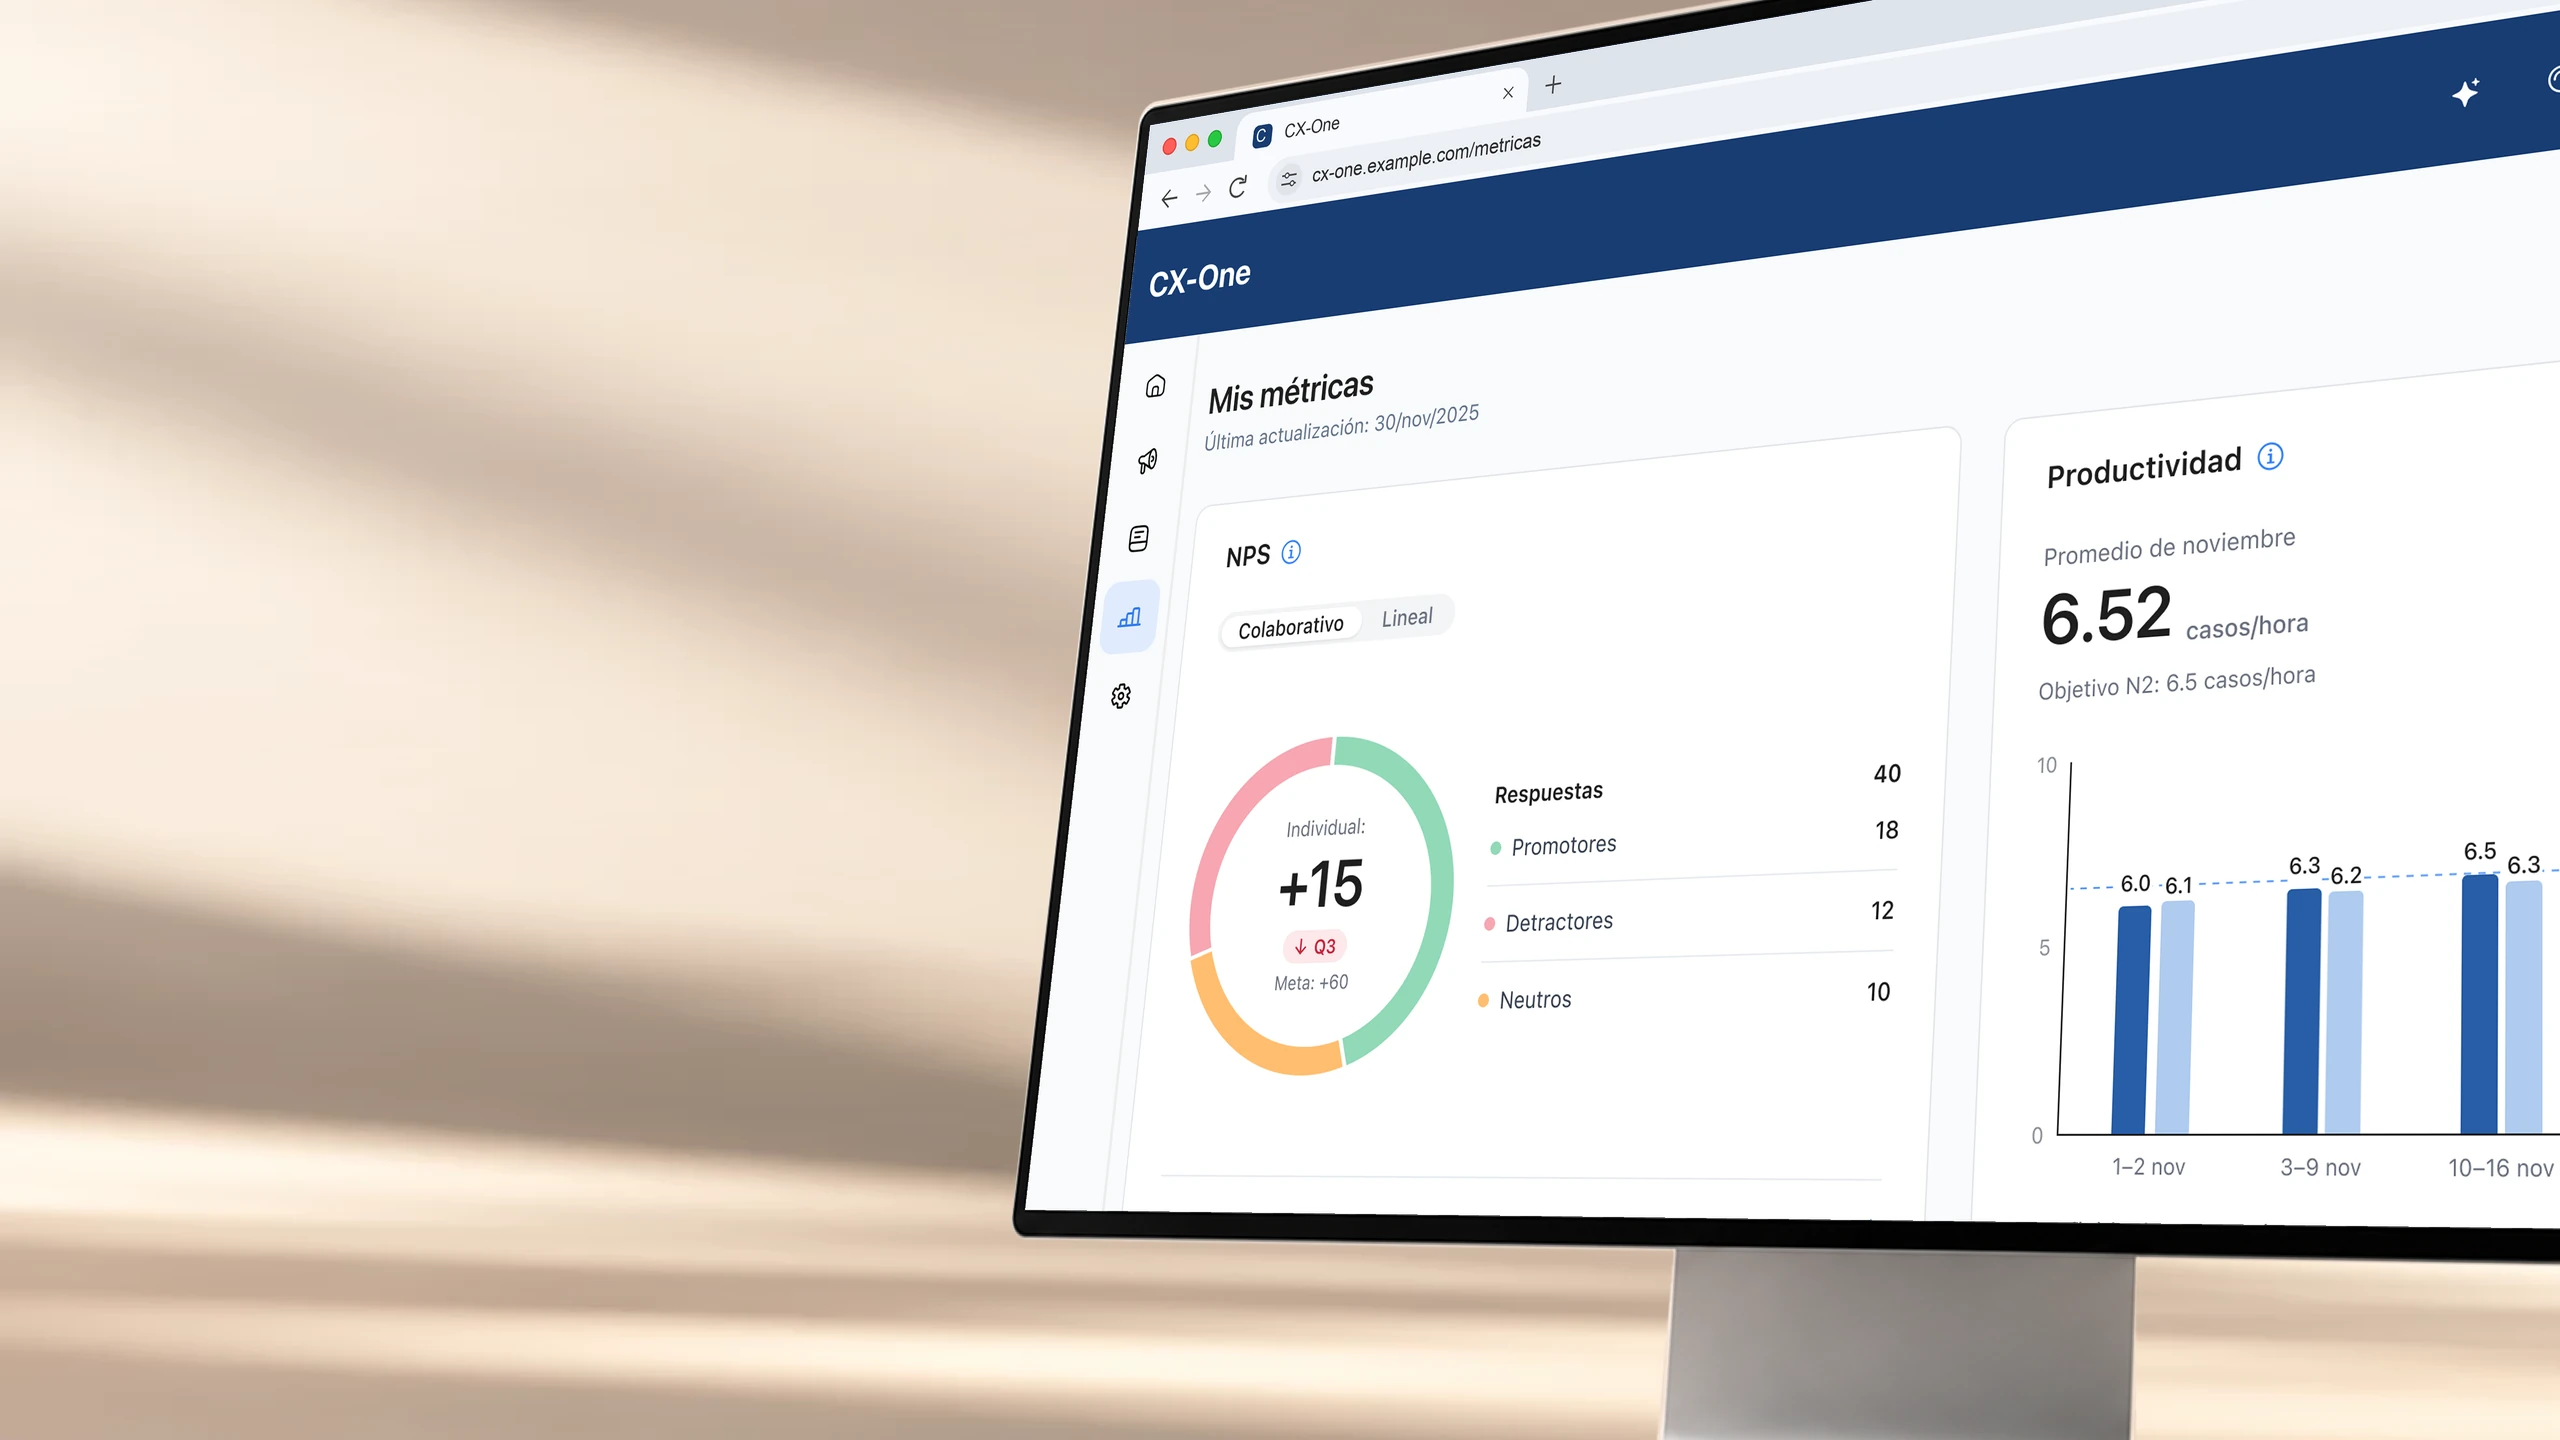
Redesigning the CX-One My Metrics Dashboard
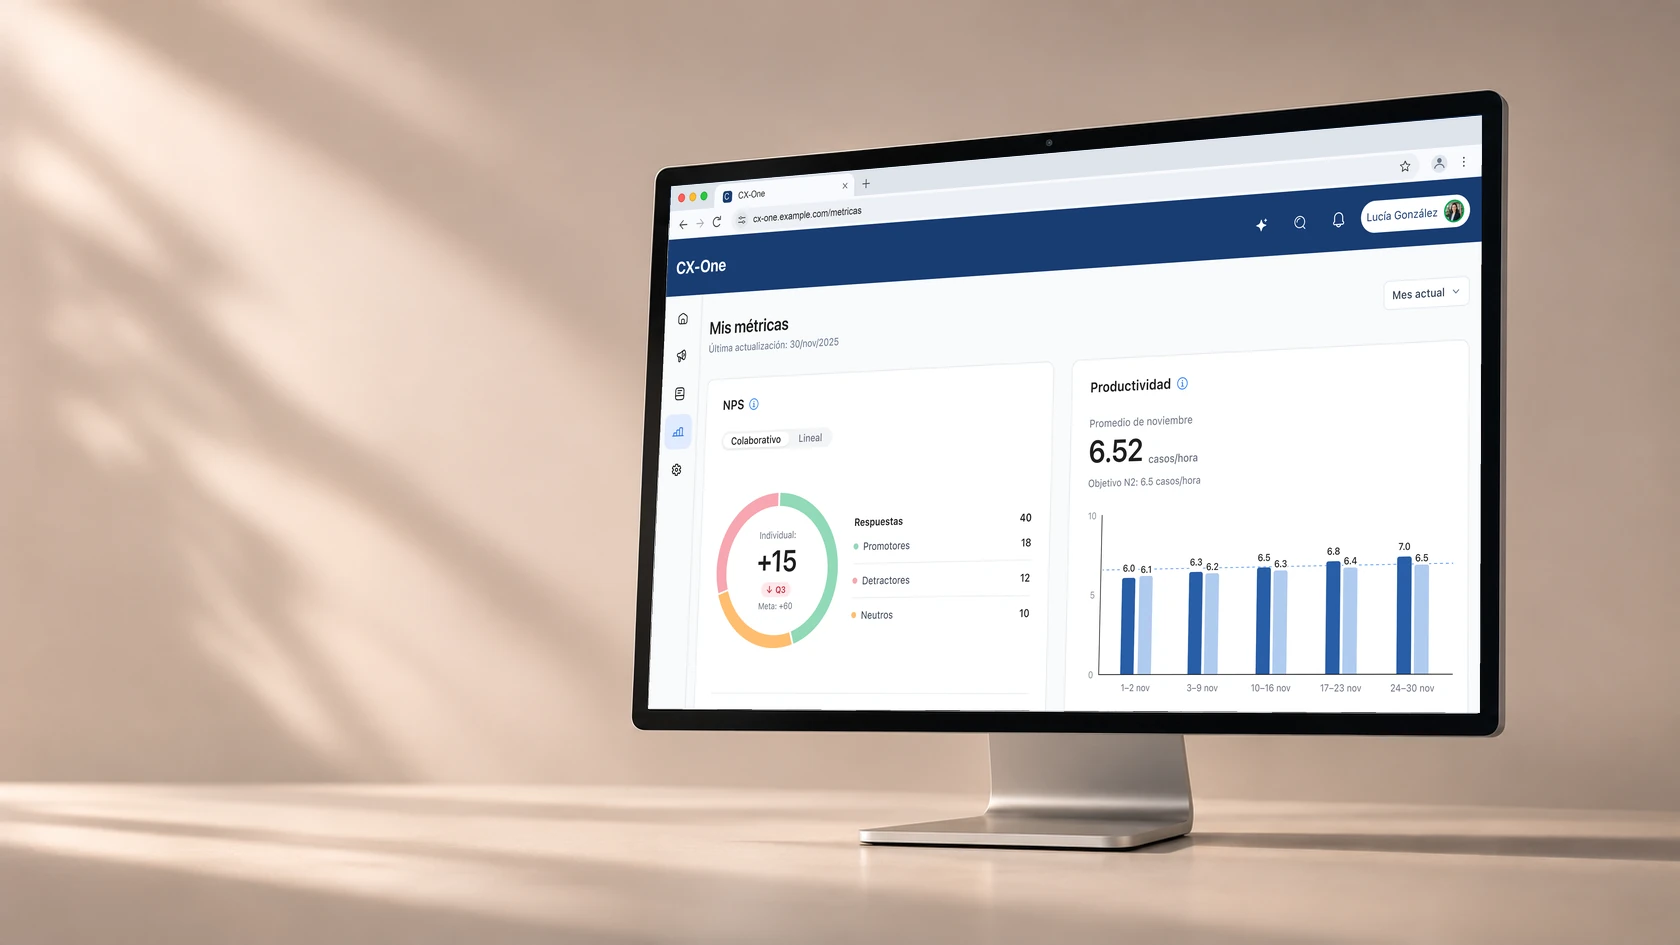
Redesign of CX-One's performance dashboard, an internal tool used by Mercado Libre's Customer Support team. The goal was to improve the clarity, reliability, and accessibility of the metrics representatives use to understand and evaluate their performance.
01
The problem
The existing My Metrics dashboard provided access to performance indicators, but lacked clarity, made results difficult to interpret, and undermined trust in the information.
This led representatives to rely on external tools and documentation to verify their results.
The challenge went beyond improving the interface. It required rethinking which information was displayed, how it was calculated, and how it could be presented in a clear and reliable way.
02
Process
Understanding the metrics
We worked with the teams responsible for generating performance indicators, defining evaluation criteria, and interpreting the information representatives need to understand their results.
Reorganizing information
We redesigned the dashboard to prioritize key indicators, improve how results are presented, and make comparisons against targets easier to understand.
Exploring the details
We incorporated charts and informational microinteractions to provide additional context without overwhelming the main view.
Aligning and refining
We reviewed and validated the proposed solutions with the teams responsible for the metrics and performance evaluations, while also checking representatives' understanding of the dashboard.
03
Screens
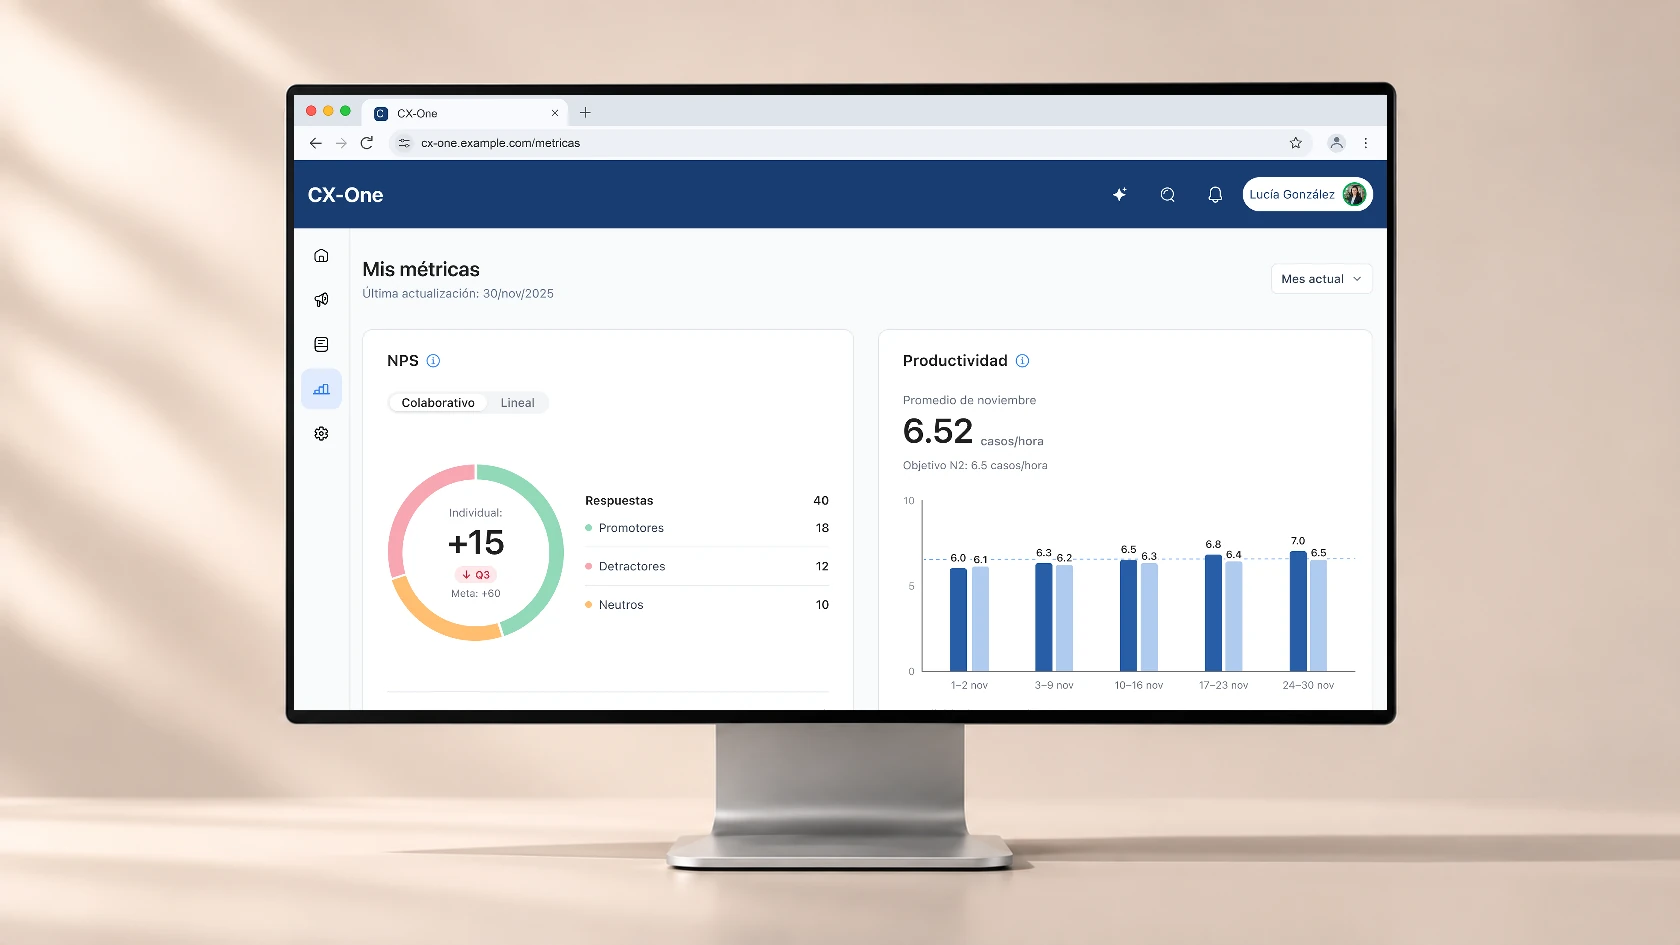
A clearer view of performance
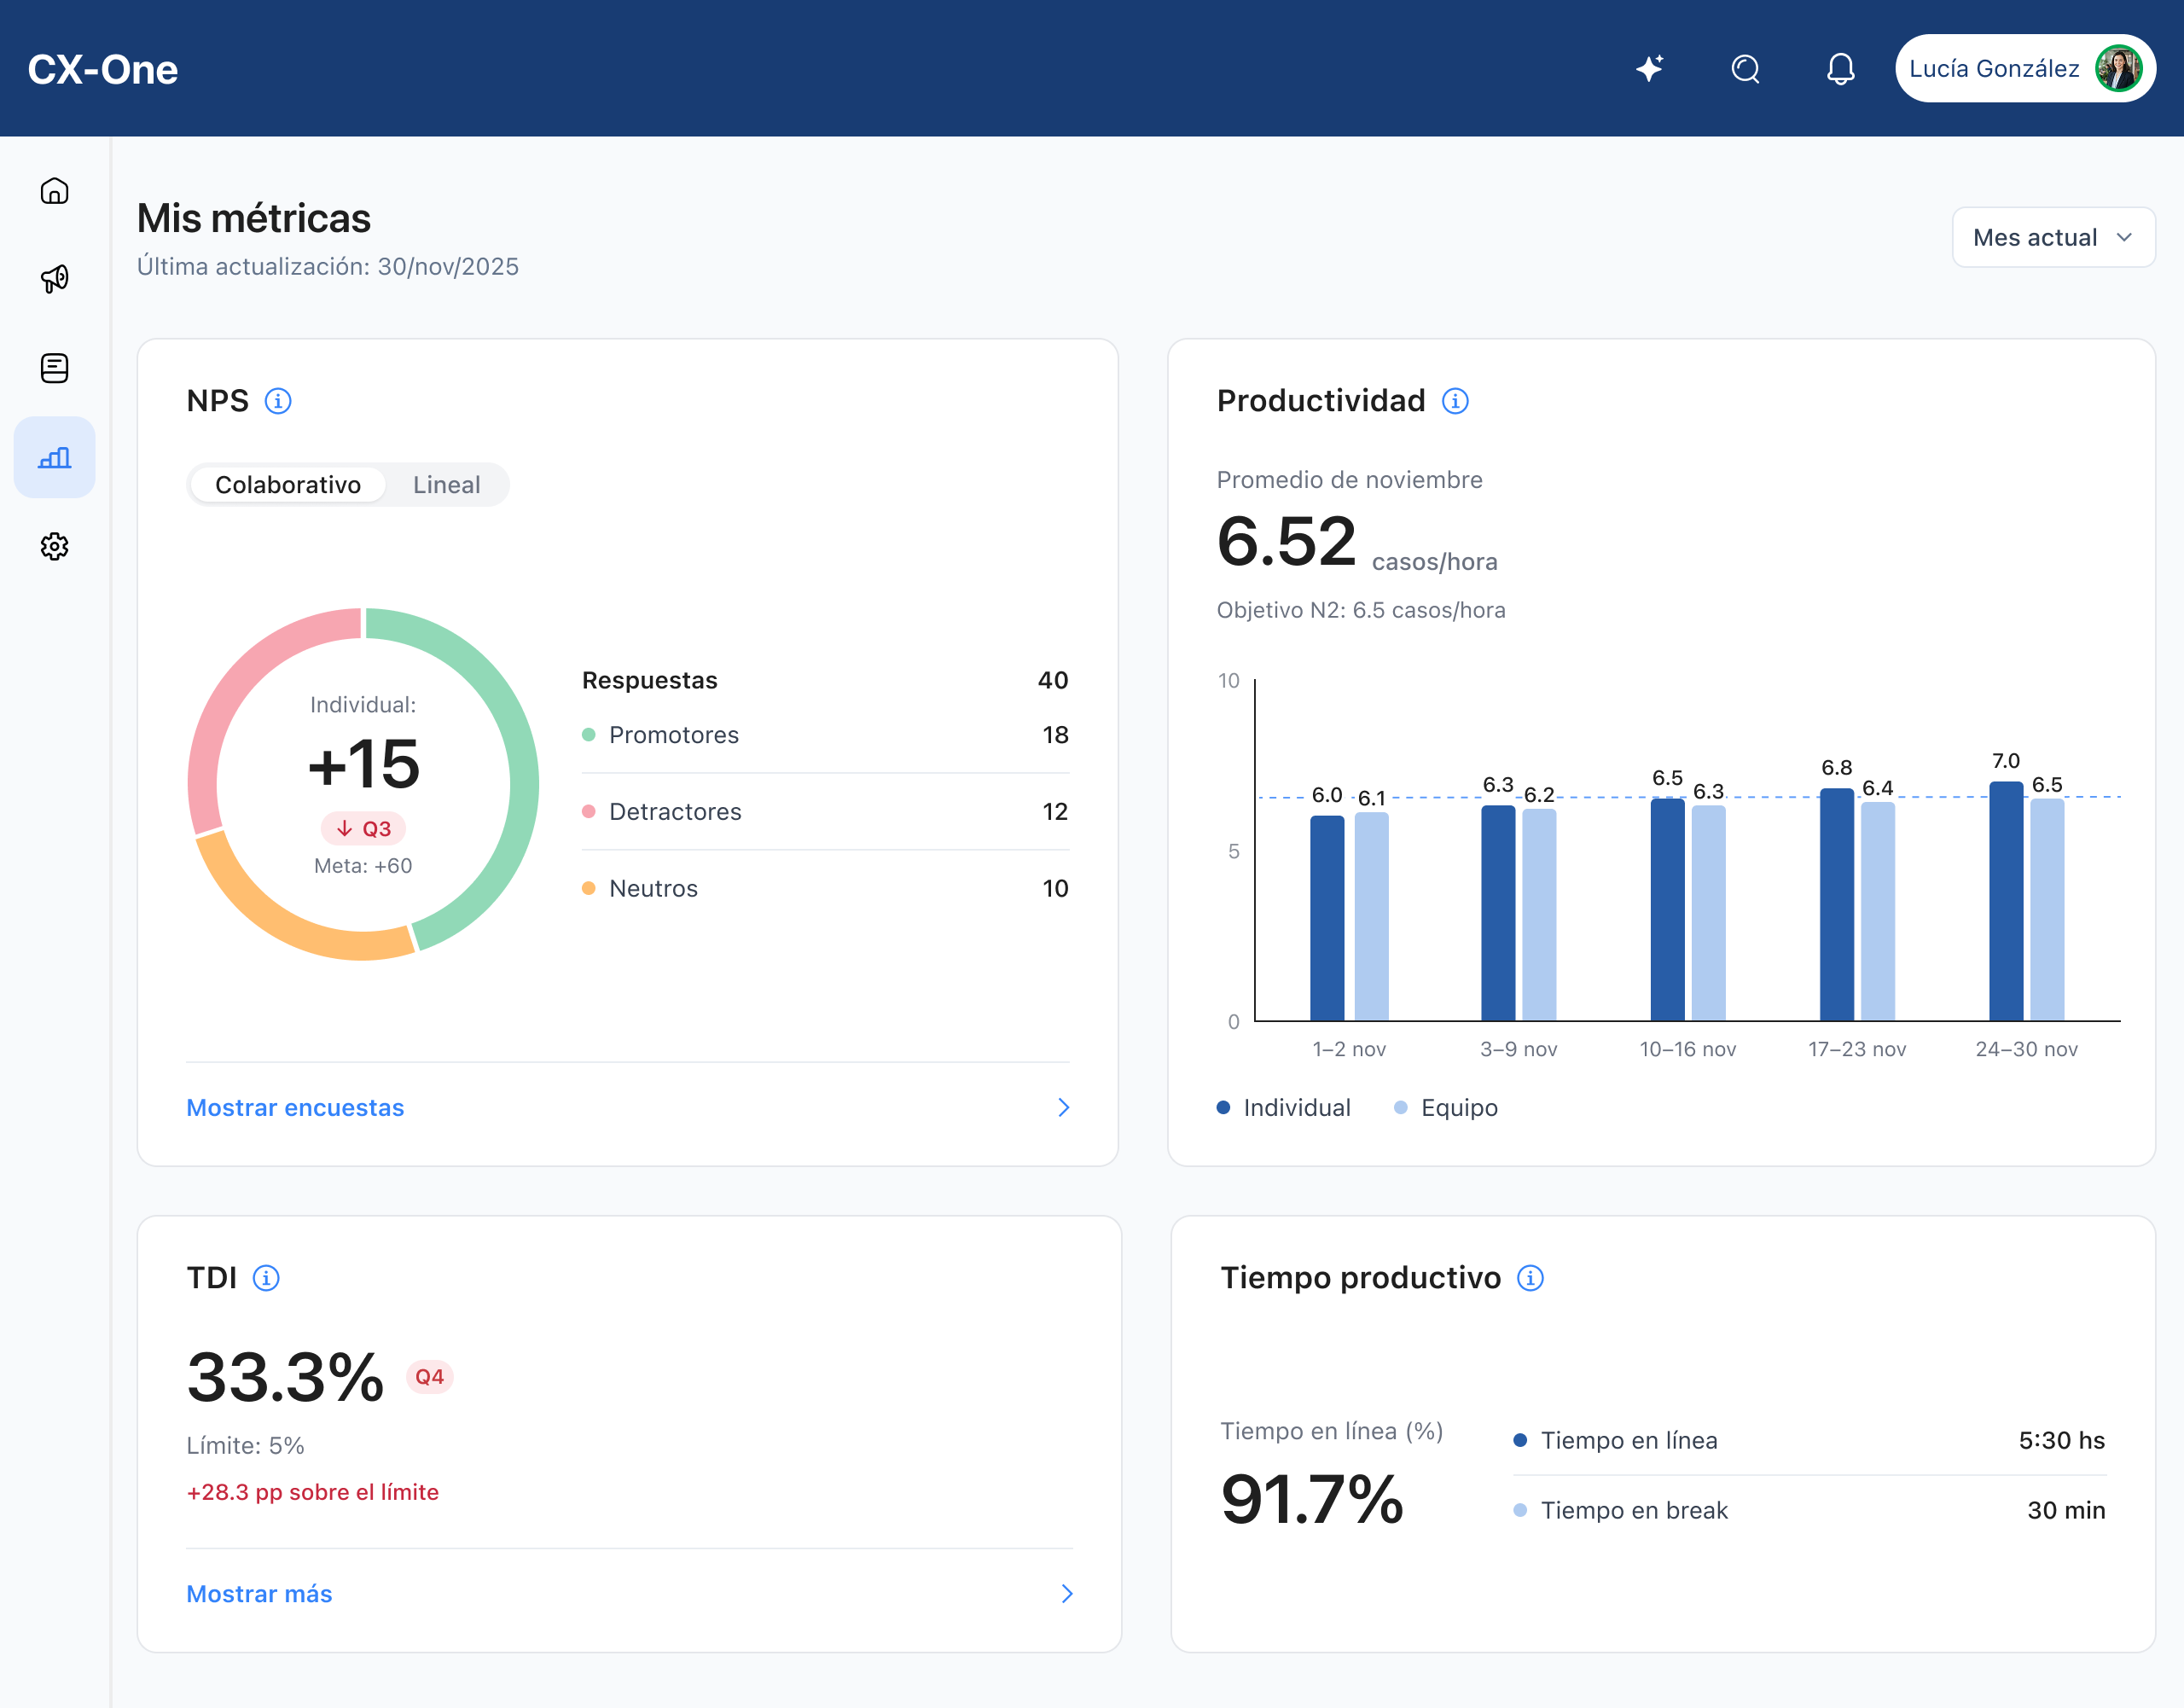
NPS, productivity, TDI, and productive time come together in a single view. Each indicator presents the information representatives need to understand their results and how they compare with the targets defined by Customer Support.
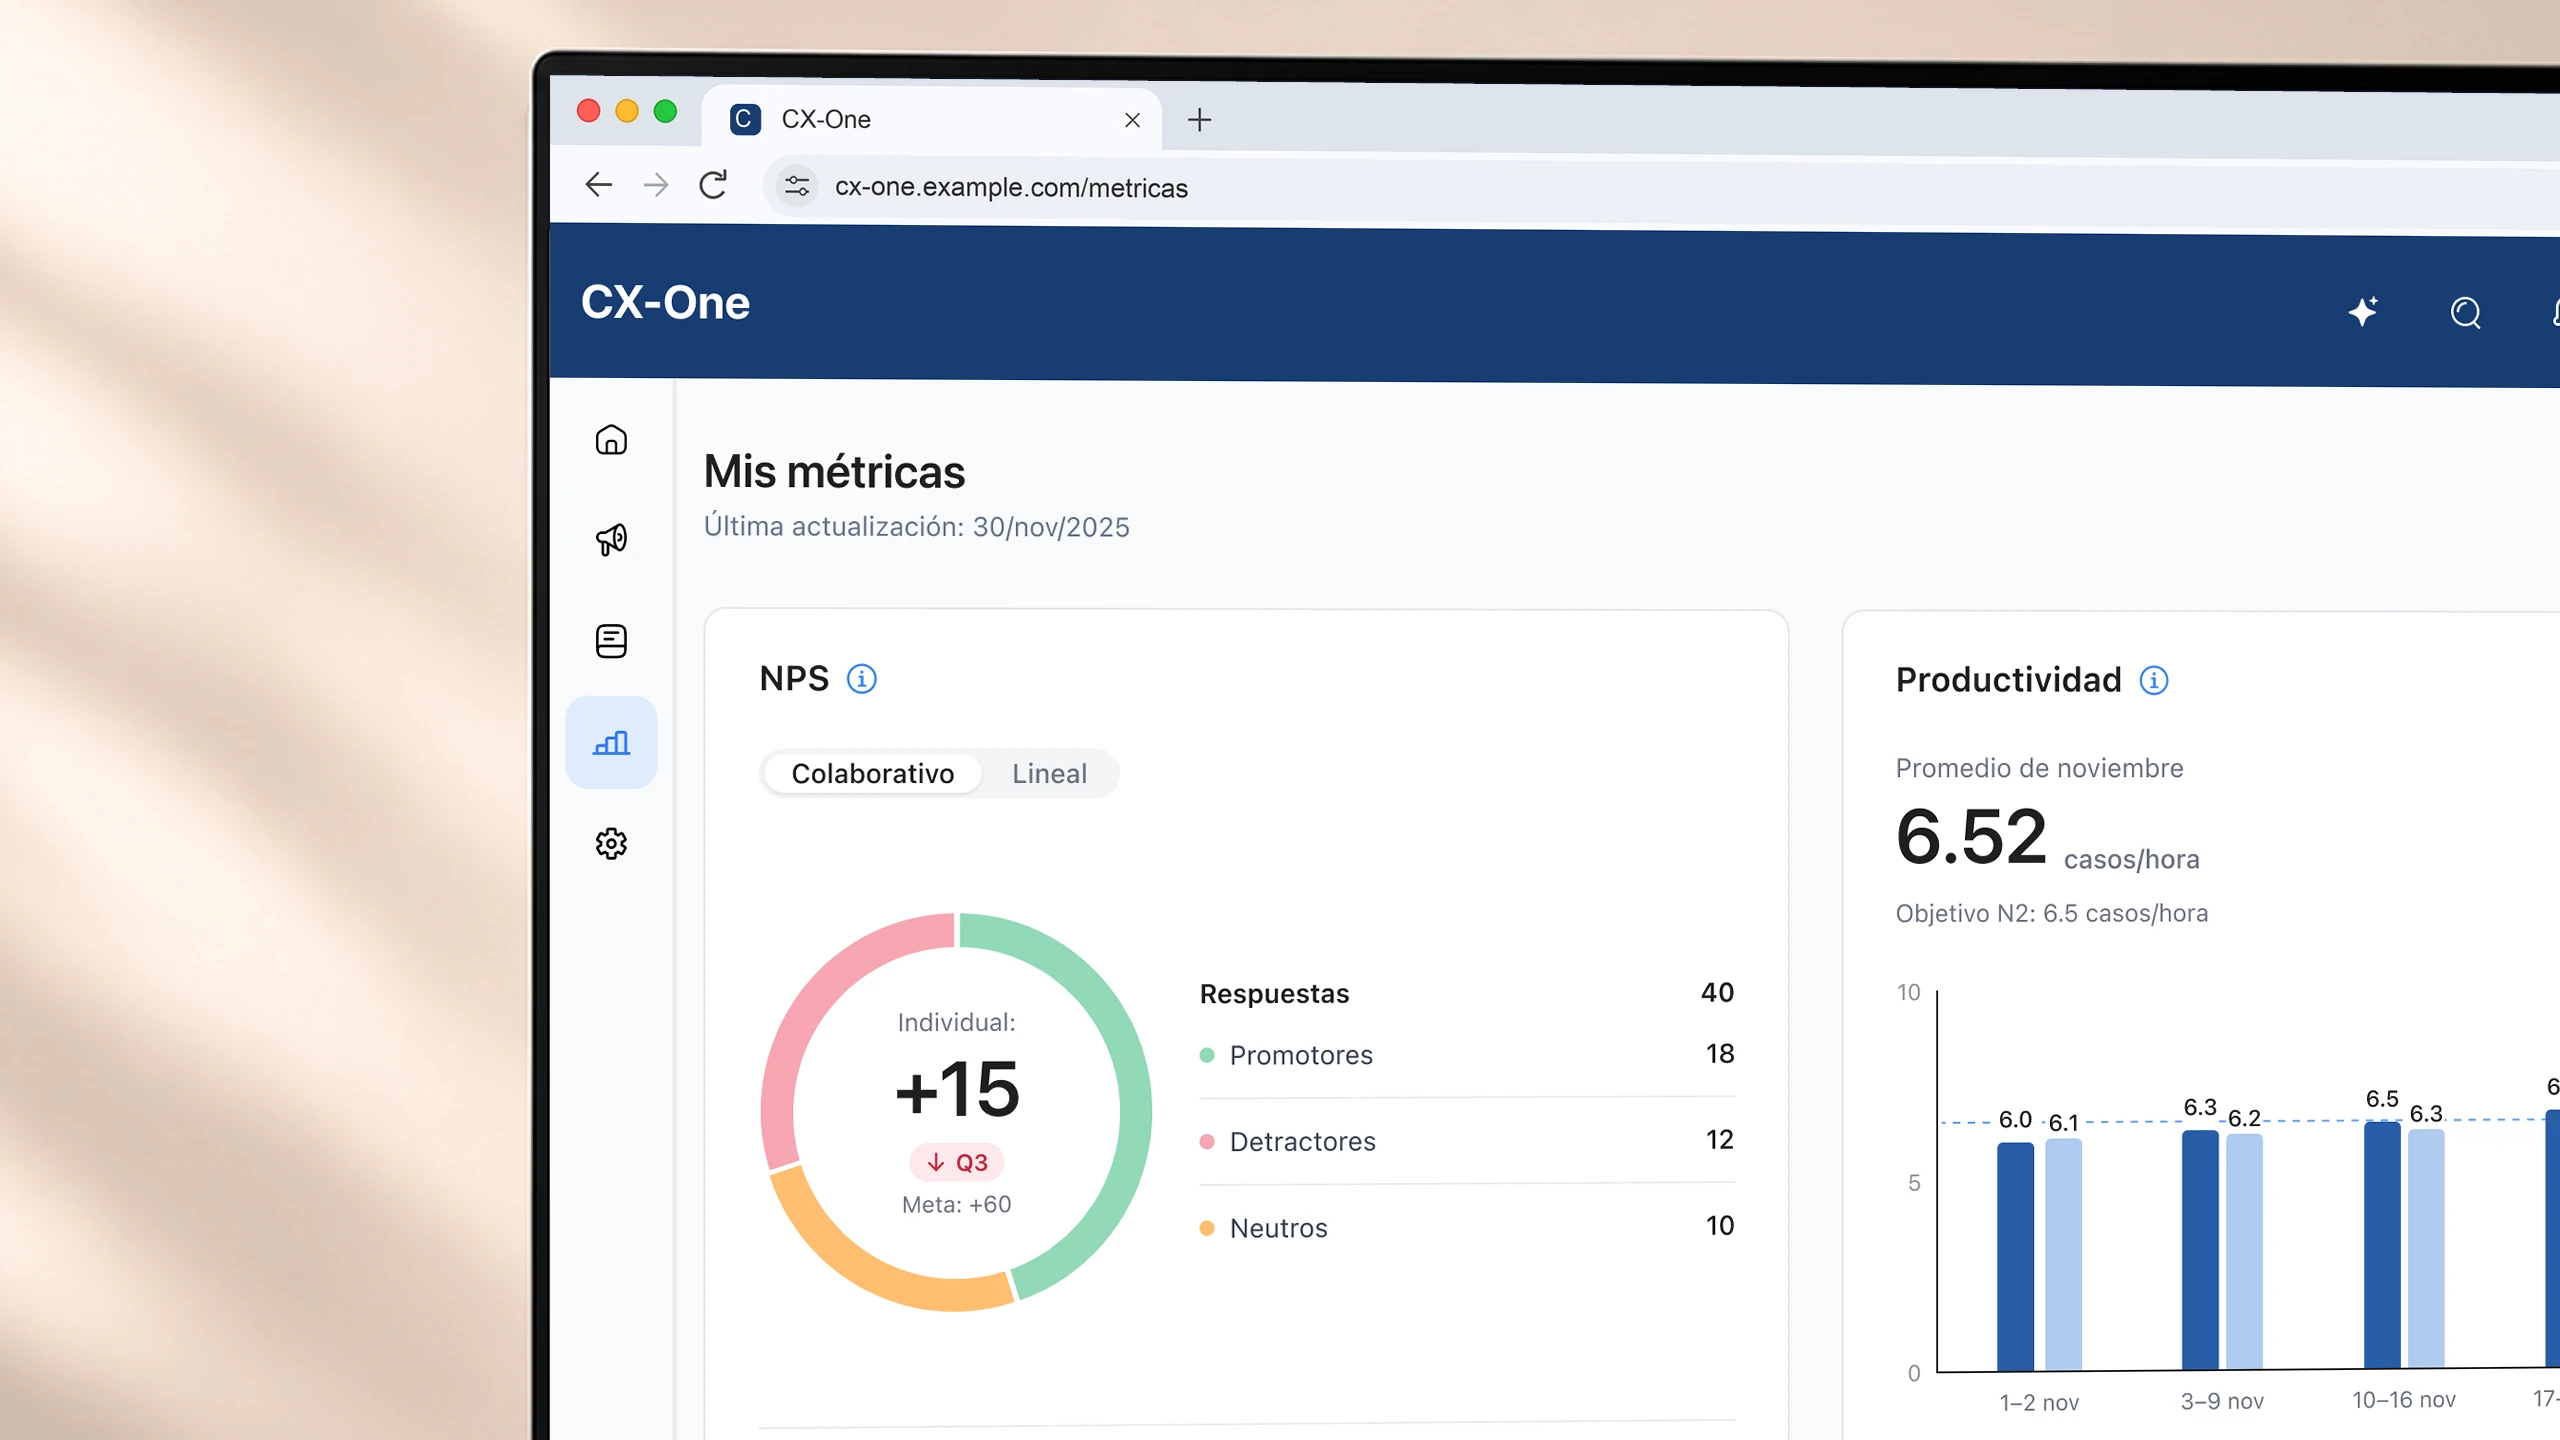
More context behind the results
NPS combines individual scores, targets, and trends with a breakdown of promoter, detractor, and passive responses. A clearer visual hierarchy makes it easier to interpret each metric beyond a single number.
A complete view of performance
The dashboard brings together four key metrics—NPS, Productivity, TDI, and Productive Time—in a single view. Clear information hierarchy makes it easier to understand results, compare performance against targets, and access more detailed information when needed.
Compare, explore, and understand
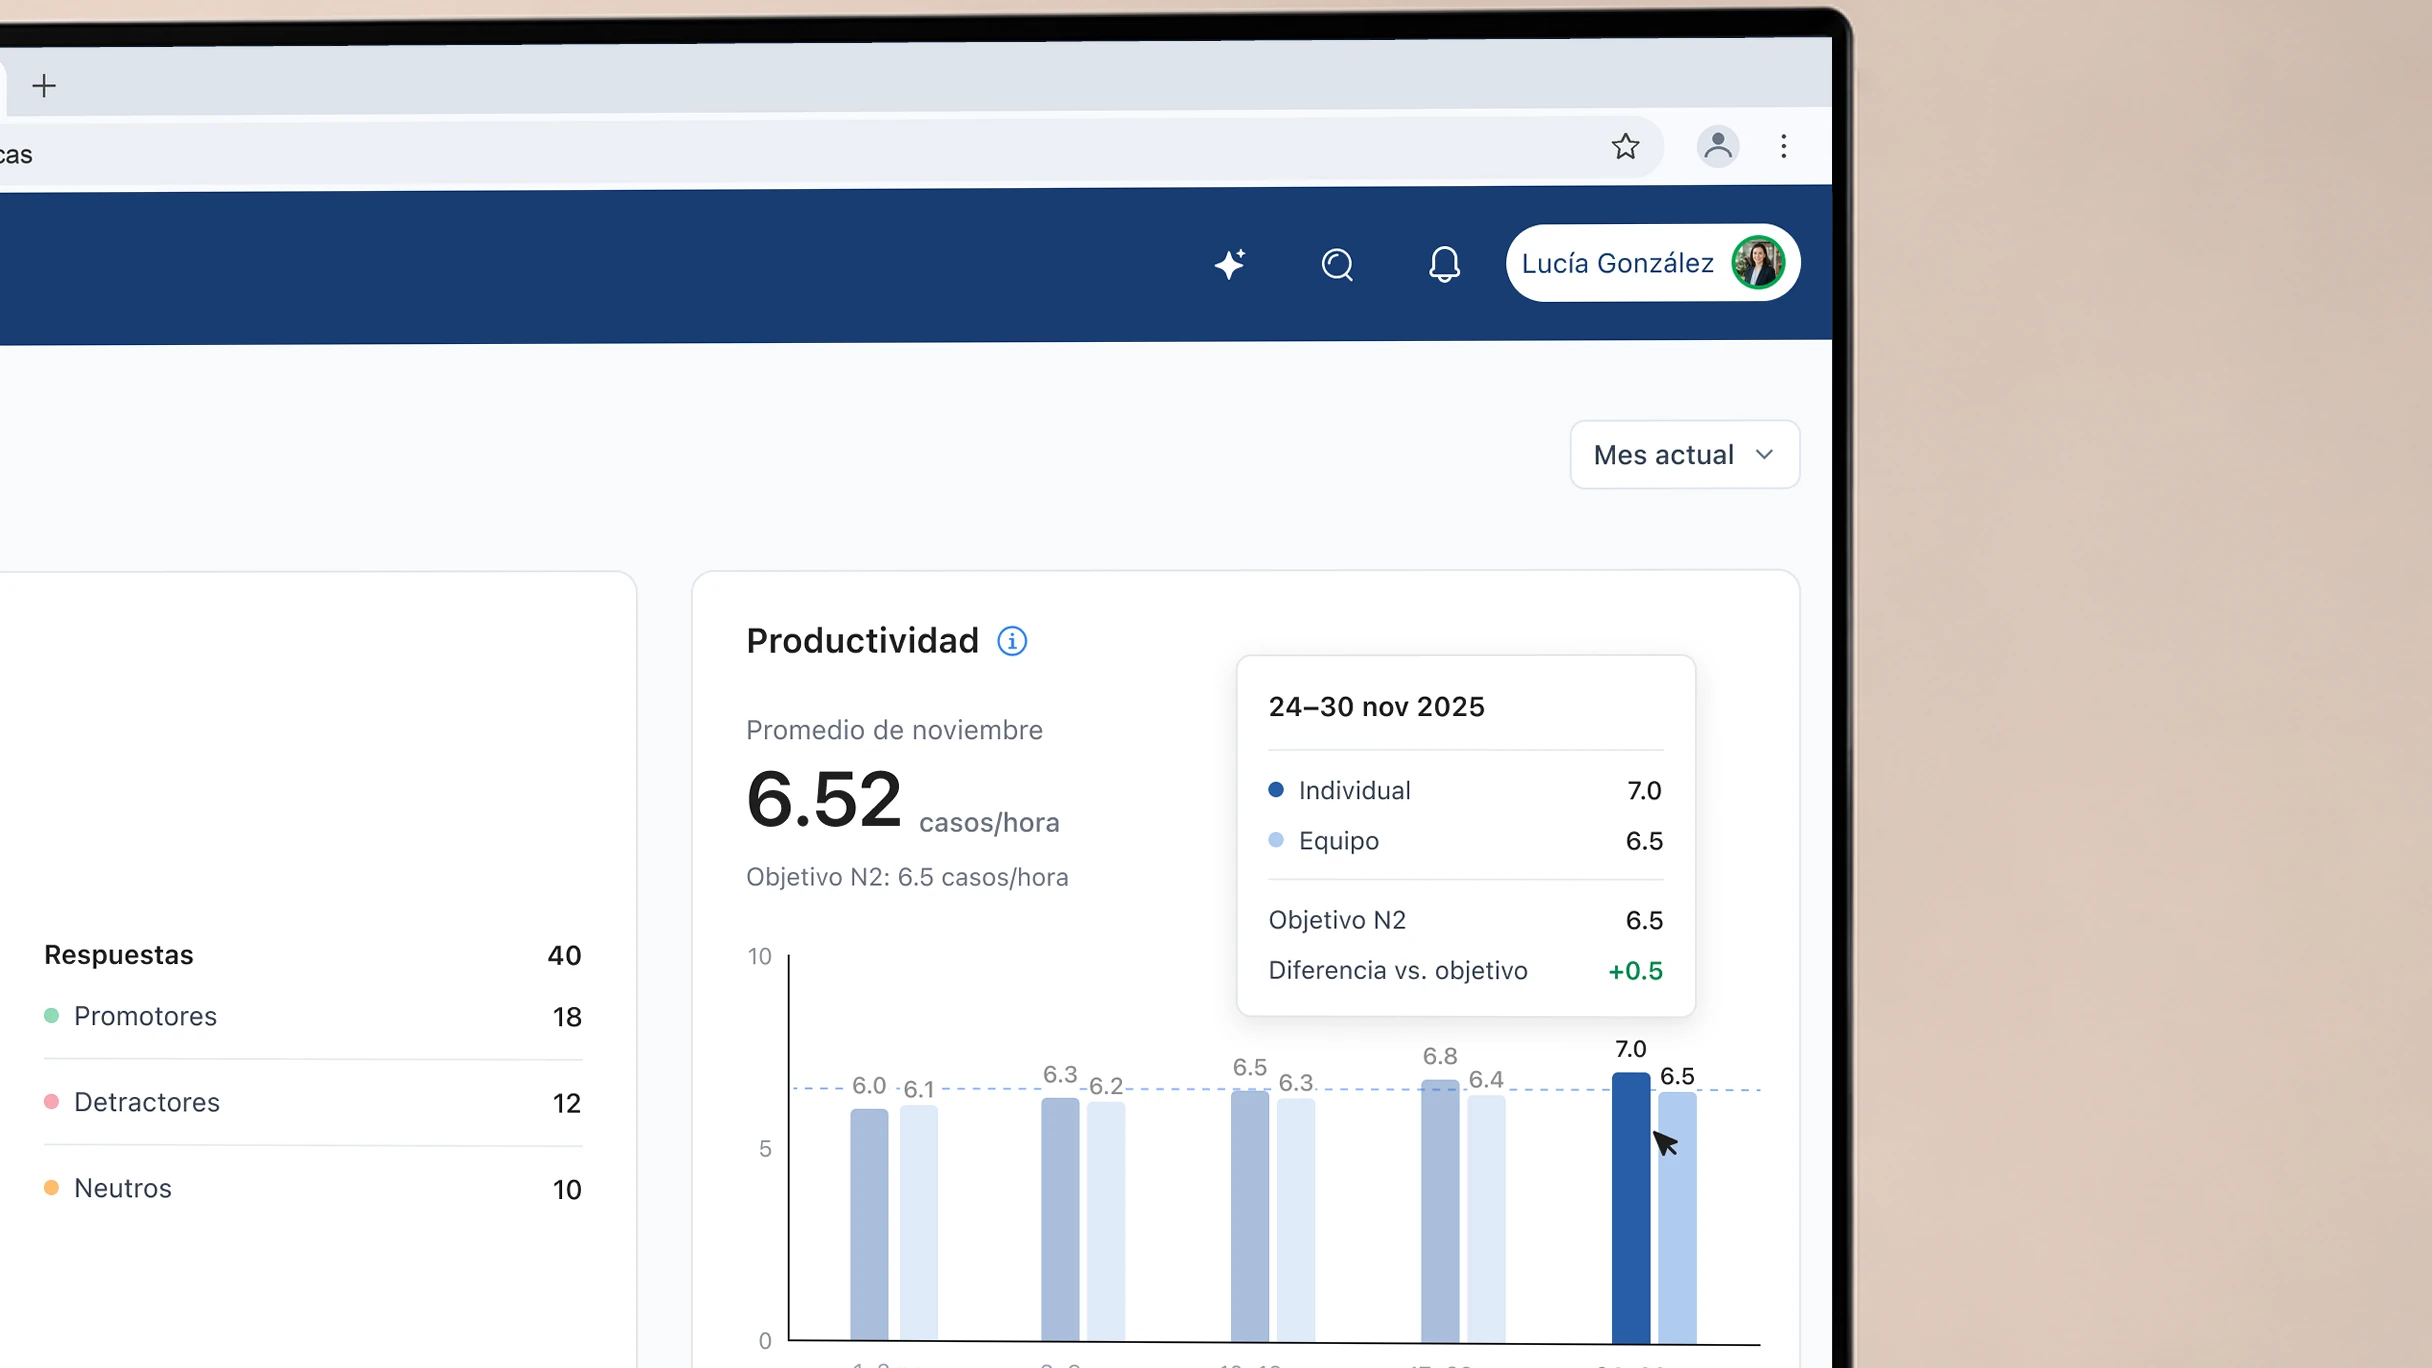
A weekly chart makes it possible to compare individual performance with team results and defined targets. Informational microinteractions provide additional context for each period without adding unnecessary complexity to the main view.
From metrics to details
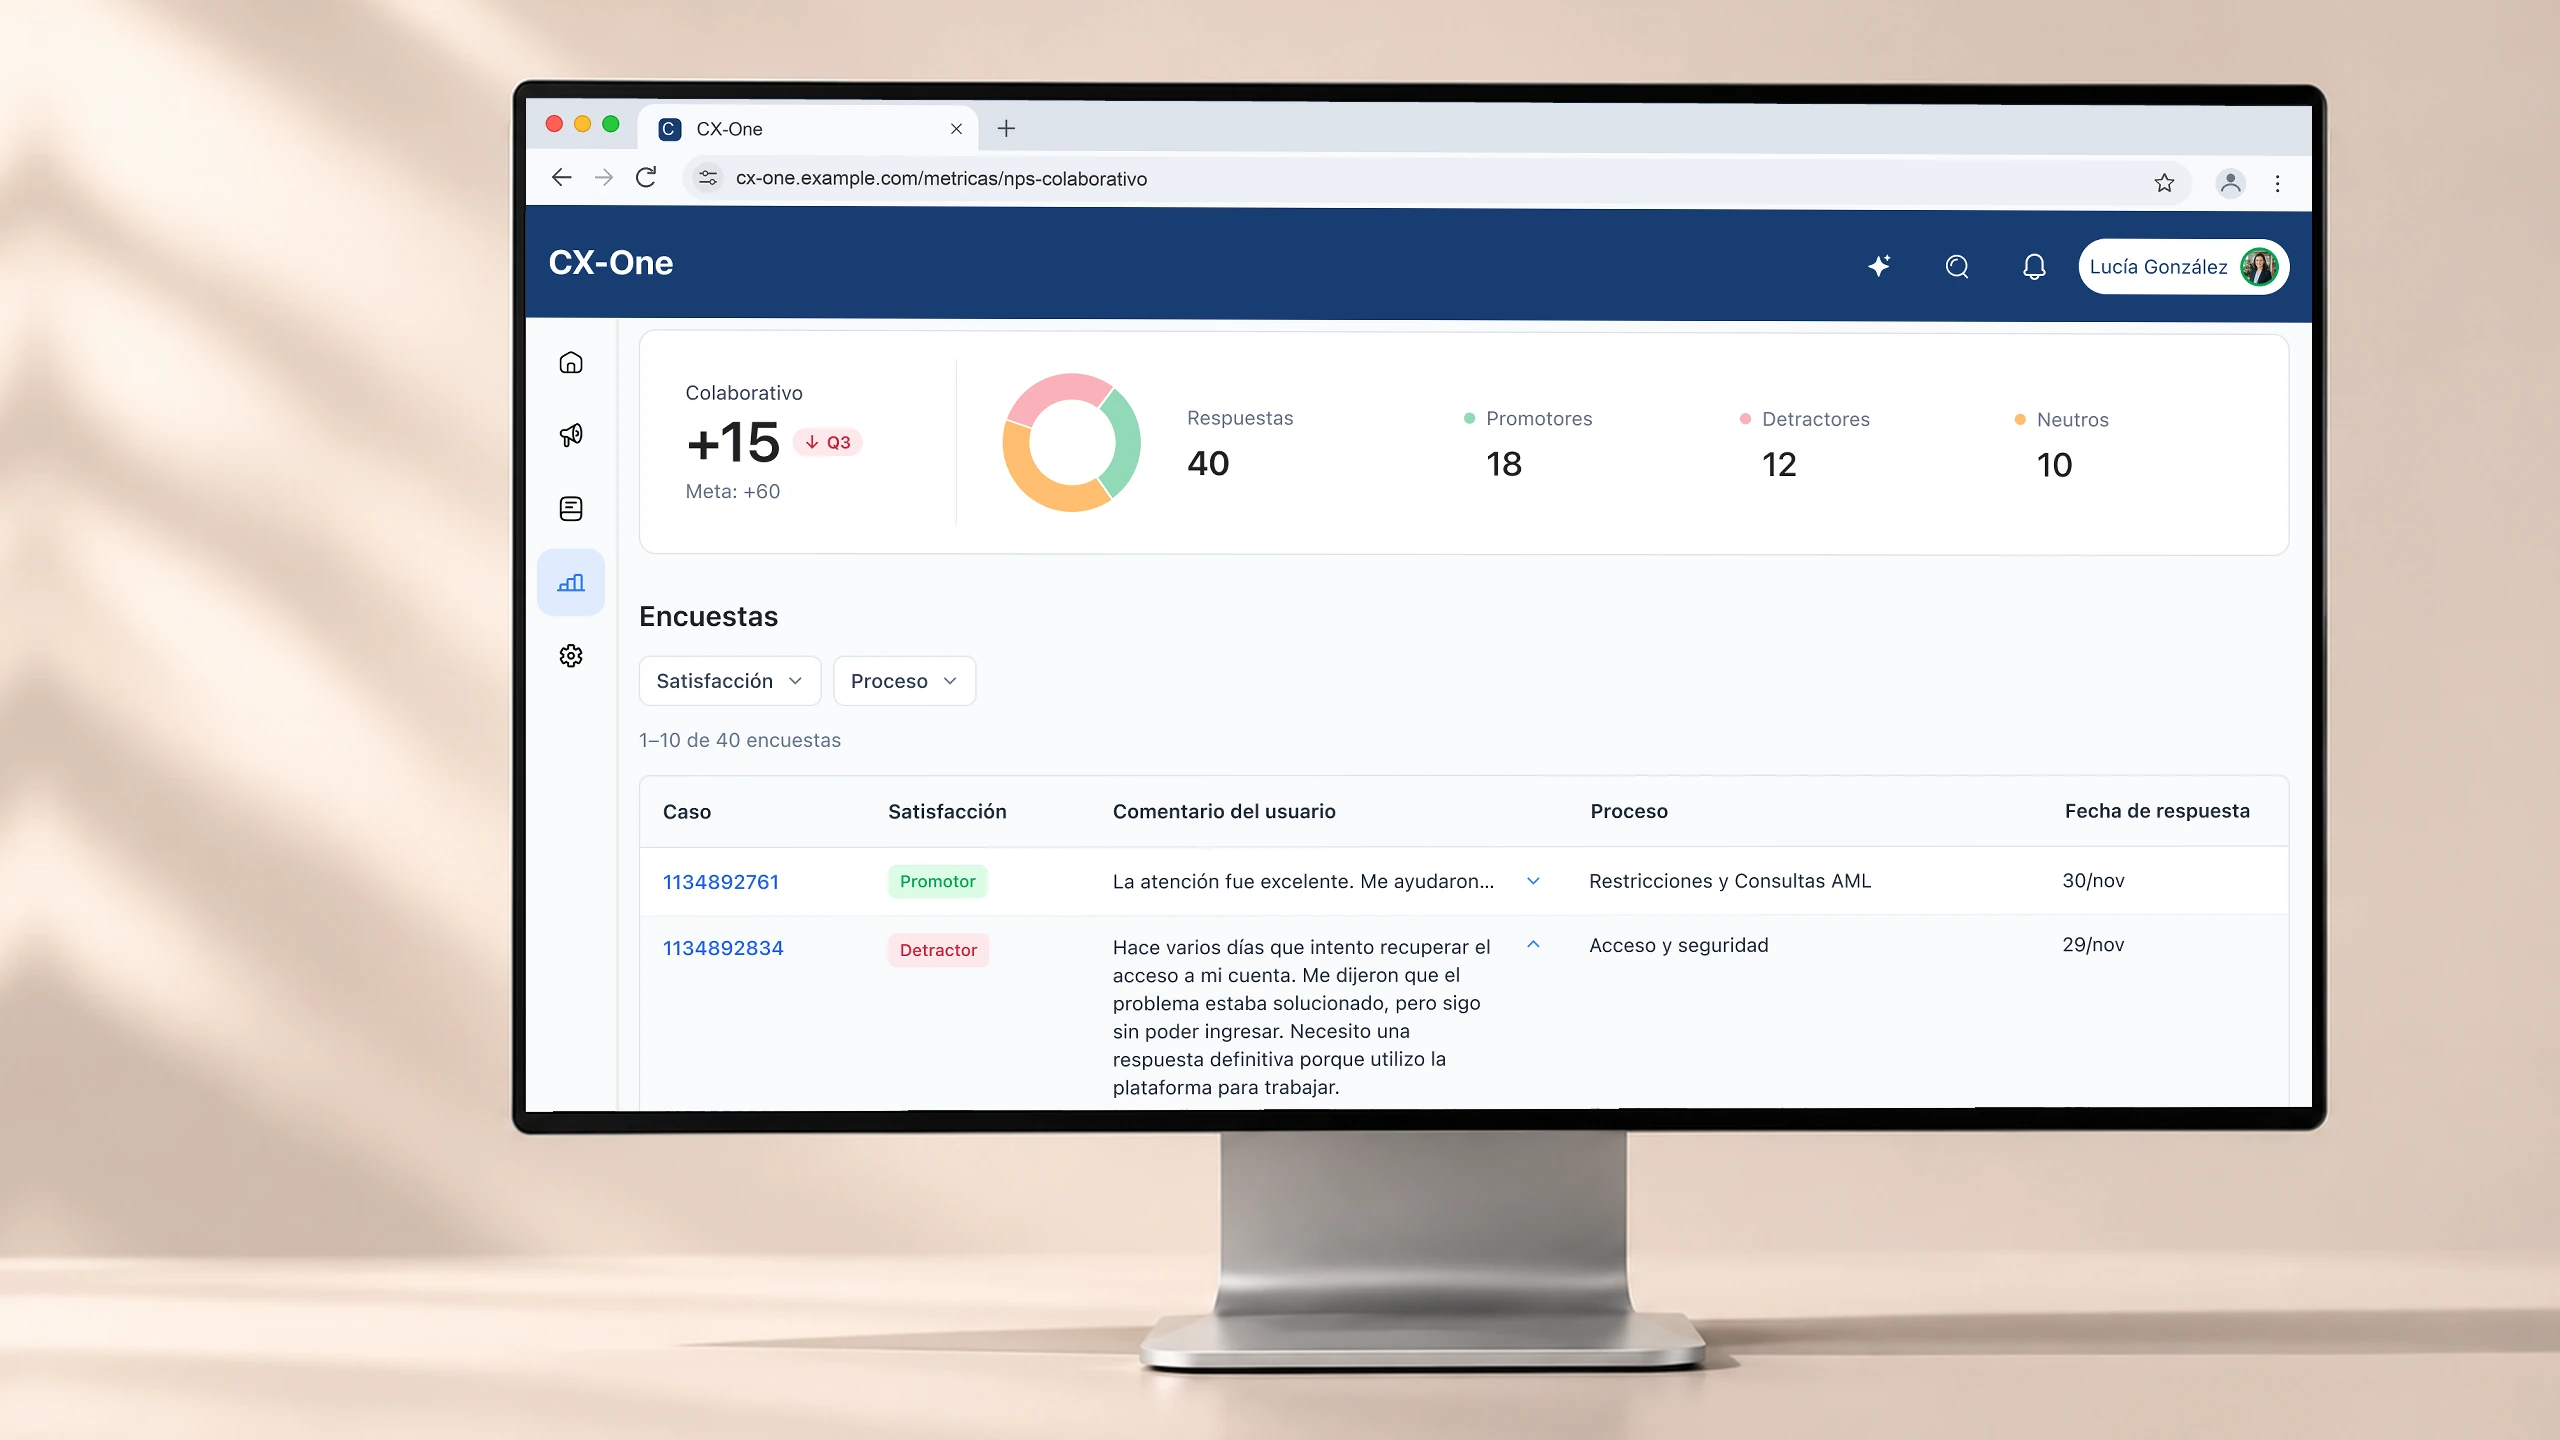
Access to survey responses allows representatives to explore the feedback behind their NPS results. Expandable comments connect quantitative indicators with the experiences shared by users.
04
Outcome
I supported the implementation of the redesign, which was partial by the time I left Mercado Libre. The design covered four languages: Spanish, Portuguese, English, and Chinese.
The improvements that shipped reduced reliance on external tools and documentation to verify performance metrics, and increased users’ trust by presenting more reliable information.
Beyond improving the interface, the project laid out a more consistent foundation for introducing additional evaluation metrics and further centralizing performance information within CX-One. The remaining scope was still pending when I left.